Visualizing with TensorBoard
TensorBoard is an open source toolkit created by the Google Brain team for model visualization and metrics tracking (specifically designed for Neural Networks). The primary use of this tool is for model experimentation — comparing different model architectures, hyperparameter tuning, etc. — and to visualize data to gain a better understanding of the selected model (which may help figure out what works/what doesn’t and how to improve the existing model). In this blog, our goal is to provide a basic understanding of TensorBoard and illustrate its use in a real-world example (a movie recommendation system) so that you will be able to incorporate this tool in any of your ML projects.
Getting the Tool
____
TensorBoard is typically bundled along with your installation of TensorFlow. As such, you do not need to explicitly install TensorBoard; simply installing TensorFlow by executing the following command from your terminal is sufficient.
pip install --upgrade tensorflowFor a system-wide installation, you may need to add the “--user” option.
If for some reason TensorBoard was not installed correctly with TensorFlow (or if you do not want to install TensorFlow), you can manually install the tool as follows.
pip install tensorboardFeatures of TensorBoard
____
TensorBoard offers a number of different ways for you to visualize/track different kinds of data. Each of these can be viewed in its own separate section called a “Dashboard.” Below is a list of the most commonly-used Dashboards.
- Scalars
- Graphs
- Distributions
- Histograms
- Embeddings Projector
- Images
Each of these Dashboards is in its own tab and you can switch between them by selecting the appropriate tab from the list located at the top of the TensorBoard UI (shown below).
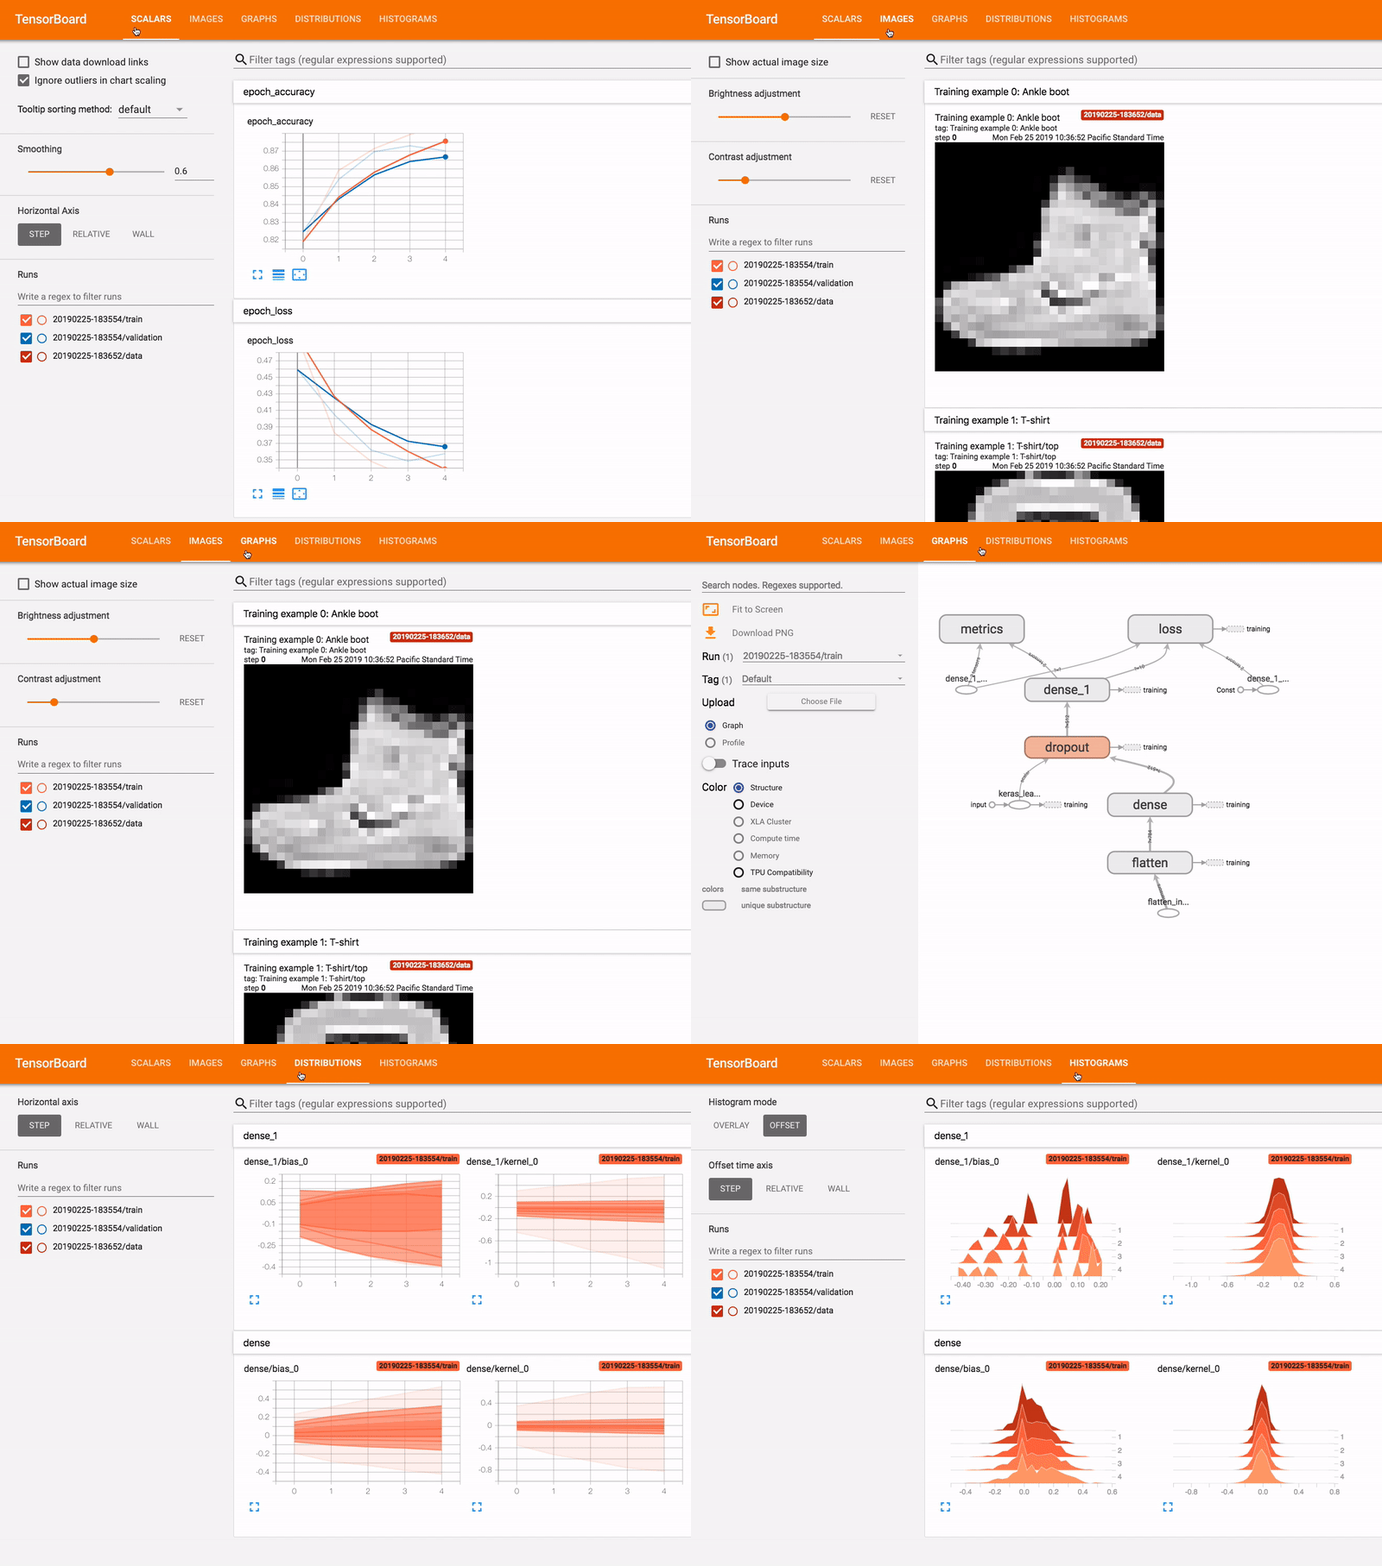
In this section, we provide brief descriptions for each of these Dashboards.
Scalars
Every machine learning project typically involves the use of evaluation metrics like error/loss, accuracy, and so on. These metrics change over the course of a training session (number of epochs). The “Scalars” Dashboard in TensorBoard allows users to easily visualize these metrics, which can help tune hyperparameters (such as number of epochs, learning rate, number of layers, etc.), prevent overfitting, and also help identify problems with the selected architecture (for e.g., if the weights never converge to optimal values). Additionally, you can get side-by-side plots for multiple ML models to compare and rate their performance.

Graphs
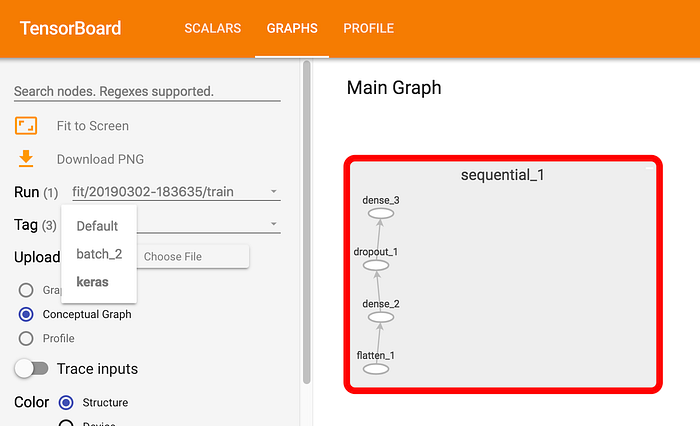
In Deep Neural Networks, we typically have many layers. While TensorFlow provides a relatively simple API to define these layers, it is possible to make minor errors in specifying the properties of individual layers or connections between them. TensorBoard’s “Graphs” Dashboard provides the means to view a conceptual graph of your neural network that may help ensure that its design is as intended and quickly identify any contradictions. Additionally, you can also view an op-level graph to visualize the different functions applied to tensors in your model (such as linear algebra or activation functions) and the order in which they are applied.
Distributions
The “Distributions” Dashboard allows users to visualize how non-scalar data (weights or other tensors) change over time. TensorBoard provides separate plots for each tensor in your ML project so that you can monitor them separately. These plots typically show major statistics of the tensor, i.e. min, max and mean values, at each time step (training epoch). Seeing how these change over time allows you to identify problems with your model’s properties— if the learning rate is too large, weights may change erratically, which should caution you to lower the value of the hyperparameter.

Histograms
An alternate way to visualize the distribution of your data is through histograms. While the distributions plot in the previous section provides information about global statistics of the tensor, histograms provide a more local context, allowing you to see how data within specific ranges of values — called “buckets” — change. TensorBoard automatically aggregates the values in a tensor into buckets and shows a 3D plot of histograms over time (training epochs).

Embeddings Projector
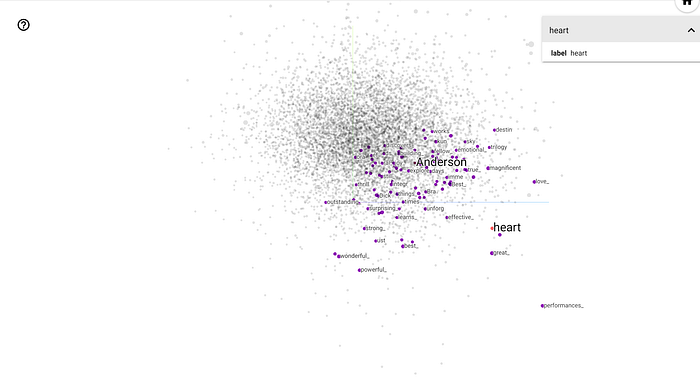
The “Projector” Dashboard allows users to visualize high-dimensional data (tensors) in a 2D/3D view. This allows you to examine and understand embedding layers of a neural network. For example, if our model is designed to generate word embeddings and we plot the results using this tool, we can identify words that have similar meanings as they would appear close together — conversely, if extremely dissimilar words are grouped together, there could be a problem with our model and it may need to be re-trained.
Images
In some cases, you may want to log certain images/plots that are relevant to your ML model. TensorBoard allows you to store such images along with the rest of your logs (histograms, graphs, and the like). Additionally, you can also store audio samples and text in a similar manner.

A Neural Approach to Movie Recommendations
________
Now that we have a rough understanding of the different functionalities provided by TensorBoard, we shall demonstrate the use of each of these through the example of a movie recommendation system.
Design Overview
____
The main goal of a movie recommendation system is to use information about movies and users to determine the top K movies that a specific user may like. In our implementation, we shall first generate embeddings for movies and users. Embeddings are low-dimensional, learned representations of data. They are typically used to obtain a continuous vector representation for discrete, categorical variables (such as words/text). When we cast these embeddings in N-dimensional space, variables similar to each other (for e.g., words with similar meanings) are located close to each other. (For a more detailed explanation on embeddings, refer to the following blog post.)
We shall use this idea of embeddings to cast movies and users into a common embedding space, so that we can directly identify users and movies that are similar. For example, in our embedding space, embeddings of movies rated highly by a certain user will appear closer to the user embedding. The downside of this approach, however, is that the model would not be able to handle new users (the embeddings need to be retrained in such cases).
To then recommend movies to a particular user, we simply generate the user embedding and use K-nearest neighbors (KNN) to return the nearest movies in the embedding space.
For this demonstration, we shall only focus on the first part (generating the embeddings) — since this is where we can truly appreciate the use of TensorBoard as a visualization tool. The entire code (along with the KNN part) can be viewed here.
Preparing the Data
____
We shall use the MovieLens dataset (which is considered as the gold standard for movie recommendations) for this demonstration. Specifically, we shall use the “100 K Dataset” which can be downloaded from the official website.
You may download this dataset and manually read the files — one each for user data, movie data, and ratings information — into pandas data frames using the “pd.read_csv” function. Both these steps can be directly done through code as follows:

We then merge the three data frames on the “user_id” and “movie_id” to obtain a single data frame containing all of the information.

The resulting data frame looks as follows (only the initial features are shown):

Finally, we split the dataset into a training and test set using the API provided by the sklearn library.

Setting up TensorBoard
____
Before building our ML model, we must first properly initialize TensorBoard so that it can be used in our project.
What we need to do is create a log directory where all the data to be displayed using TensorBoard shall be stored. To do this, we first open the command prompt (Windows) or terminal (Linux/Mac). We then navigate to our project’s root directory and run the following command:
tensorboard --logdir=logsHere, “logs” is the name of the directory where we shall store our TensorBoard data. (Note: Make sure that the TensorFlow library is accessible from your location, i.e. activate your virtual environment if that contains the installation).
TensorBoard should now be accessible at http://localhost:6006 by default. You may use a custom port by adding the option “--port=<port_num>” to the above command. Since you haven’t logged any data yet, you should see something as follows:

If you are using a Jupyter notebook for your project, you can add the following line to your code:
%load_ext tensorboardAnd then, view TensorBoard in a notebook cell using the command below.

(Note: You still need to start an instance of TensorBoard from the terminal as shown earlier.)
Generating the Embeddings
____
To generate the movie embeddings, we first build a simple neural network containing an embedding layer whose output is flattened into a 1D movie vector; the input to this model is the “movie_id” — you may also use other information present in the MovieLens dataset such as genre, popularity, budget, etc. (which may help create better embeddings for movies), though we shall stick to the “movie_id” alone to make this demonstration simpler.

Here, we select EMBEDDING_SIZE=10; furthermore, NUM_MOVIES represents the number of unique movies in our dataset, while ROW_COUNT denotes the total number of entries.
We follow a similar approach and create a model for user embeddings.
Finally, we combine the outputs of the two embedding models by taking a dot product of their outputs and pass it through a 4-layer neural network, the output of which is a single value representing the rating of the movie given by the user.

Training the Model
____
We then train our model on the training dataset using the “movie_id” and “user_id” as inputs, and the “rating” as the intended output of the neural network. Additionally, we use the test dataset to perform validation and use the EarlyStopping callback from the keras module to prevent our model from overfitting — by ending the training session early if the validation accuracy/loss is getting worse. (Note: We do not need a separate validation dataset since we are not trying to predict the output rating here, but are simply using that output to generate embeddings for the movies and users.)

After training the model, we can easily get movie embeddings using
movie_model.predict(movie_id)… and user embeddings as
user_model.predict(user_id)This is due to the fact that both these models share layers with the combined model and the embedding weights were, therefore, trained along with it.
Using TensorBoard to Visualize the Model
The TensorBoard Callback
____
Now that we have set up the code for our embedding-generation task, let’s use TensorBoard to explore properties of our model. The easiest way to do this is through a keras callback (like the one we used for EarlyStopping during training).
The basic format of this callback is shown below.
tf.keras.callbacks.TensorBoard(<arguments>)Among the list of arguments that can be provided to this function call, the most common ones are as follows:
- log_dir : This argument is always required; it specifies the log directory containing all TensorBoard data (which we initialized earlier as “logs”).
- histogram_freq : Specifies the frequency (in epochs) at which histograms are computed for the layers of the model; setting it to 0 disables histogram plots.
- write_graph : Setting this parameter to “True” enables graph visualizations in the TensorBoard Dashboard.
- write_images : Just like with graphs, setting this to “True” allows users to visualize model weights during training as images.
- update_freq : This is the update frequency for scalars such as loss and accuracy; it can either be set to “batch”/“epoch” (to update after every batch/epoch) or an integer representing the number of batches.
- embeddings_freq : Similar to histogram_freq, except that this defines the frequency for visualizing embeddings in the Projector Dashboard.
For this demonstration, we shall use the following values for the arguments:

To use this callback, we simply add it to the list of callbacks defined during the training step earlier.
Once training is complete, we can visualize our data in Tensorboard at http://localhost:6006 (or in a notebook cell, if you prefer). Let’s look at the outputs for our current model.
Scalars Dashboard

In our embeddings model, we have two evaluation metrics — accuracy and loss — plots of which can be seen in the screenshot above; we also have a third plot “epoch_mean_squared_error,” though this is the same as loss (the duplication is because there are two tensors containing the data related to the loss).
As can be seen, each plot contains two separate line graphs — one for the training dataset and another for validation. Each of these graphs can be toggled using the radio buttons/checkboxes in the “Runs” menu located in the left toolbar. In our demonstration, we only trained the model once. However, we can run the model multiple times (by changing values of some/all of the hyperparameters) and log data for the runs within the same “logs” directory, but under separate sub-directories (typically named using the timestamp). Doing this allows us to compare the scalar plots in this Dashboard across multiple versions/runs of the model (these can be toggled just like the datasets).
Images Dashboard
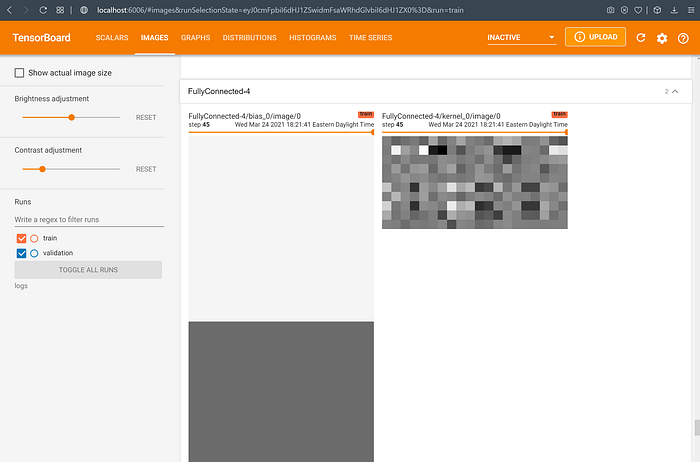
Here, we can visualize the weights of the different layers of our model as images, where the value of weights is represented by pixel intensities. This isn’t very helpful for our movie embeddings example (as seen above, the images don’t really tell us much), but could be extremely useful in image classification and related tasks, where the layers themselves encode parts of the input image.
Graphs Dashboard

By default, TensorBoard displays the op-level graph that gives a detailed view of the various function calls taking place from the perspective of the code. This may be a bit too detailed for most projects (except where we define custom functions that operate on tensors and we want to ensure that it is being applied at the right step).
In our movie recommendation project, we are more interested in viewing the conceptual graph (which displays the different layers of our neural network) rather than the op-level graph. To do this, we set the “Tag” option in the left toolbar to “keras” (by selecting it from the drop-down). If the model appears as a single node, you can view its internal structure by double-clicking on it. You should see a graph as follows:

As can be seen, it is much easier to understand the structure of our neural network from the graph above than by looking at the code shown earlier; with deeper or more complex networks, the advantage of this visual representation is even clearer.
Distributions Dashboard

As seen above, the weights of our model change gradually over time and the transitions are smooth, rather than erratic. This suggests that our learning rate is not too large (though it may not necessarily be the best).
Histograms Dashboard

Here, we can make observations about the distribution of the weights in different layers of our neural network. For example, the “kernel_0” weights in the 1st fully-connected layer seem to approximately cluster into the ranges (-0.2, -0.1) and (0.1, 0.2), while the same in the 2nd fully-connected layer form a near-normal distribution.
Embeddings Projector
To visualize our embeddings we need to navigate to the “Projector” Dashboard. If this is not directly visible in the navigation bar at the top of the TensorBoard UI, it can be selected from the drop-down located to the left of the “Upload” button.
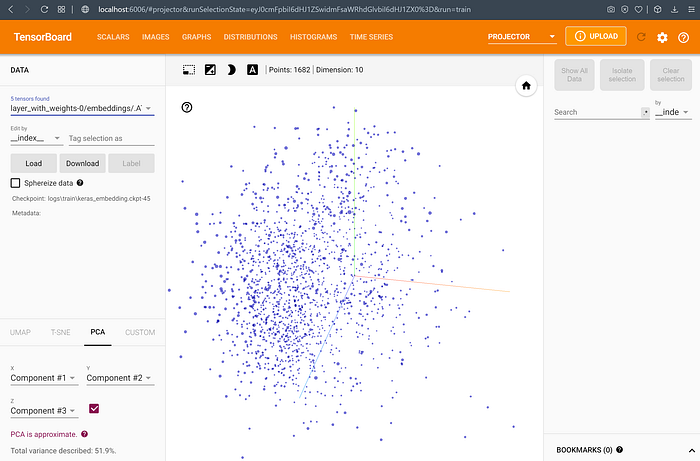
As seen above, TensorBoard allows us to visualize a high dimensional tensor (such as our embeddings) in 2D/3D space — here, it is 3D, but you can switch to a 2D view by toggling the Z-axis checkbox in the left menu. By default, Principal Component Analysis (PCA) is used to reduce the number of dimensions (from the embedding vector size to 2 or 3). This provides a static view of the weights at the end of the training session.
To visualize how the embeddings change over the course of training, you can select T-SNE from the left toolbar; the result is as follows:
The location of movie embeddings in the vector space over the first 250 iterations of training is shown in the video above; one can see that the embeddings change quite rapidly at the start, but after around 200 iterations, they are relatively stable.
(Note: Make sure to select the right tensors for the user and movie embeddings from the first drop-down in the left toolbar; these should contain the word “embeddings” in their description.)
TensorFlow Summaries
____
An alternative to using the TensorBoard callback is to use tf.summary objects in TensorFlow. These objects can be used to encapsulate different types of data which can then be readily displayed in TensorBoard. This method is preferable (over the callback technique) when you need to log specific entries rather than general model statistics — like if you want to save a custom-generated plot/figure as an image to the TensorBoard Dashboard (so that you can view it later).
Below is a list of the different summary objects that can be created using the tf.summary API:
- tf.summary.scalar()
- tf.summary.histogram()
- tf.summary.image()
- tf.summary.audio()
- tf.summary.text()
The method to add each of the above summaries is quite similar (the difference being the arguments to each function). For the purpose of this demonstration, we shall show you how to add simple text summaries to the TensorBoard Dashboard.
Creating the SummaryWriter Object
Before we can add summaries to TensorBoard, we need to create a file writer object to save the summaries in our log directory. To do this, we simply use the create_file_writer function as follows:

The “logs” parameter in the above statement is the name of the log directory for TensorBoard.
Writing a Summary to TensorBoard
We can log a simple line of text and view it in TensorBoard, by using the following lines of code:

To create any type of summary, we need to specify a minimum of three arguments: the “name” of the summary (which will be used as the heading in TensorBoard), the “data” (in this case, the text), and the parameter “step.” This third argument is useful when we want to log different values of the data at different time steps — for e.g., logging the weights of a neural network every epoch. In the text summary example, we only log a single line of text — representing the training time for the model (computed from the “start” and “end” timestamps. Accordingly, we set the “step” to arbitrary value (here, step=0). In general, however, we would set this “step” argument to to the current iteration of the training loop.
Viewing the Summary
If we now go to the “Text” Dashboard in TensorBoard, we should see the text we just wrote as shown below.

Evaluating TensorBoard
________
Now that we have extensively discussed how to use TensorBoard in a machine learning project, let’s look take a look at some of the pros/cons of this tool.
Positives
- Great visualization ability for different forms of data (scalars, graphs, etc.)
- Allows you to create and add your own custom plugins
- Open source and free
- Easy to use; the tool is well documented
- Compatible with TensorFlow & PyTorch
- Large user community, making it easy to get help with errors
- Easy tacking, hosting, and sharing of results with Tensorboard.dev
Negatives
- While TensorBoard can be used separate from TensorFlow, it cannot be integrated with many popular tools in the ML workflow (like MLflow).
- If installed separately, there may be version conflicts depending on the version of TensorFlow you use (1.x or 2.x).
- The log directory can become extremely difficult to manage; while you can specify sub-folders for different models/runs, you cannot delete a specific log entry without deleting the entire folder (the file names in the log directory are not always obvious).
Summary
________
In this blog post, we have provided a brief overview of TensorBoard and the most common features provided by this tool. We have also detailed a step-by-step approach for incorporating this tool in a real-world ML project, i.e. a movie recommendation system; hopefully, this example has demonstrated the usefulness of this tool to help visualize data and experiment with ML models. Finally, we have also summarized a few pros and cons of TensorBoard, which may help you compare it against similar ML tools and pick the one most appropriate for your project. We did our best to provide as much detail as possible in the sections of this blog post, whilst trying to keep the entire blog within a reasonable length. That said, there are many other blogs out there that you can look at to explore even more of this amazing tool. We end by providing a few recommendations for your further study:
- Tutorials in the Official Documentation
- TensorBoard Tutorial — Neptune Blog
- TensorBoard Tutorial — by Thushan Ganegedara
- TensorBoard Graph Visualization
— The full code for this blog can be found here.